THE GOLF LAB ~ Simulator

Facebook  

Boards  

Shot Grouping Analysis

Wedge Grouping

    Shot groupings show your carry distances and left / right tendencies. Club selection is the art of picking the correct club to hit for the shot at hand. This requires taking trajectory tendencies, carry distance, and roll into consideration. You must know your yardages with each club in the bag to be able to pick the appropriately. Wrong club means too long or too short. 


    Going right for the pin may not be your highest percentage shot. It's important to know where on the green you should land the ball and what club will carry you and roll out to the desired distance. Knowing you hit your 9-iron to the left of the target 75% of the time, teaches you to play slightly right with that club. When the pin is in the back you select the club that carries front or middle of the green so it can roll out to the pin and not go over.

Range Grouping

IMPACT LOCATION      SWEET SPOT?

Sweet Spot
Impact Location


Where the ball hits the face of the club has a significant impact on the outcome of the shot. Most golfers try to hit the ball in the center of the club face, which is good, but on modern day drivers that is really not the true sweet spot. On almost every driver, the sweet spot that creates the highest ball speed is slightly towards the toe and slightly up from the center of the face.


If you miss your shots high on the face, the ball will launch higher, spin less, and you will lose ball speed. If it is not too high on the face, you may actually increase carry distance. If you hit too low on the face, you will create a lower launch angle, increase spin, but ball speed will increase. Learn what you club face bias is. For most golfers, hitting slightly high on the clubface of a driver is preferred over hitting low.  This is because most golfers have a negative attack angle with their drivers which means they are taking loft off the club which increases spin and causes them to lose distance.


The impact location per shot and heat map per session in the image above is from a single shot and single session analysis in our Lab. Showing you, the golfer where you are actually making contact.

SAMPLE Driver ANALYSIS

Ron's Driver Analysis (one of my better swings)

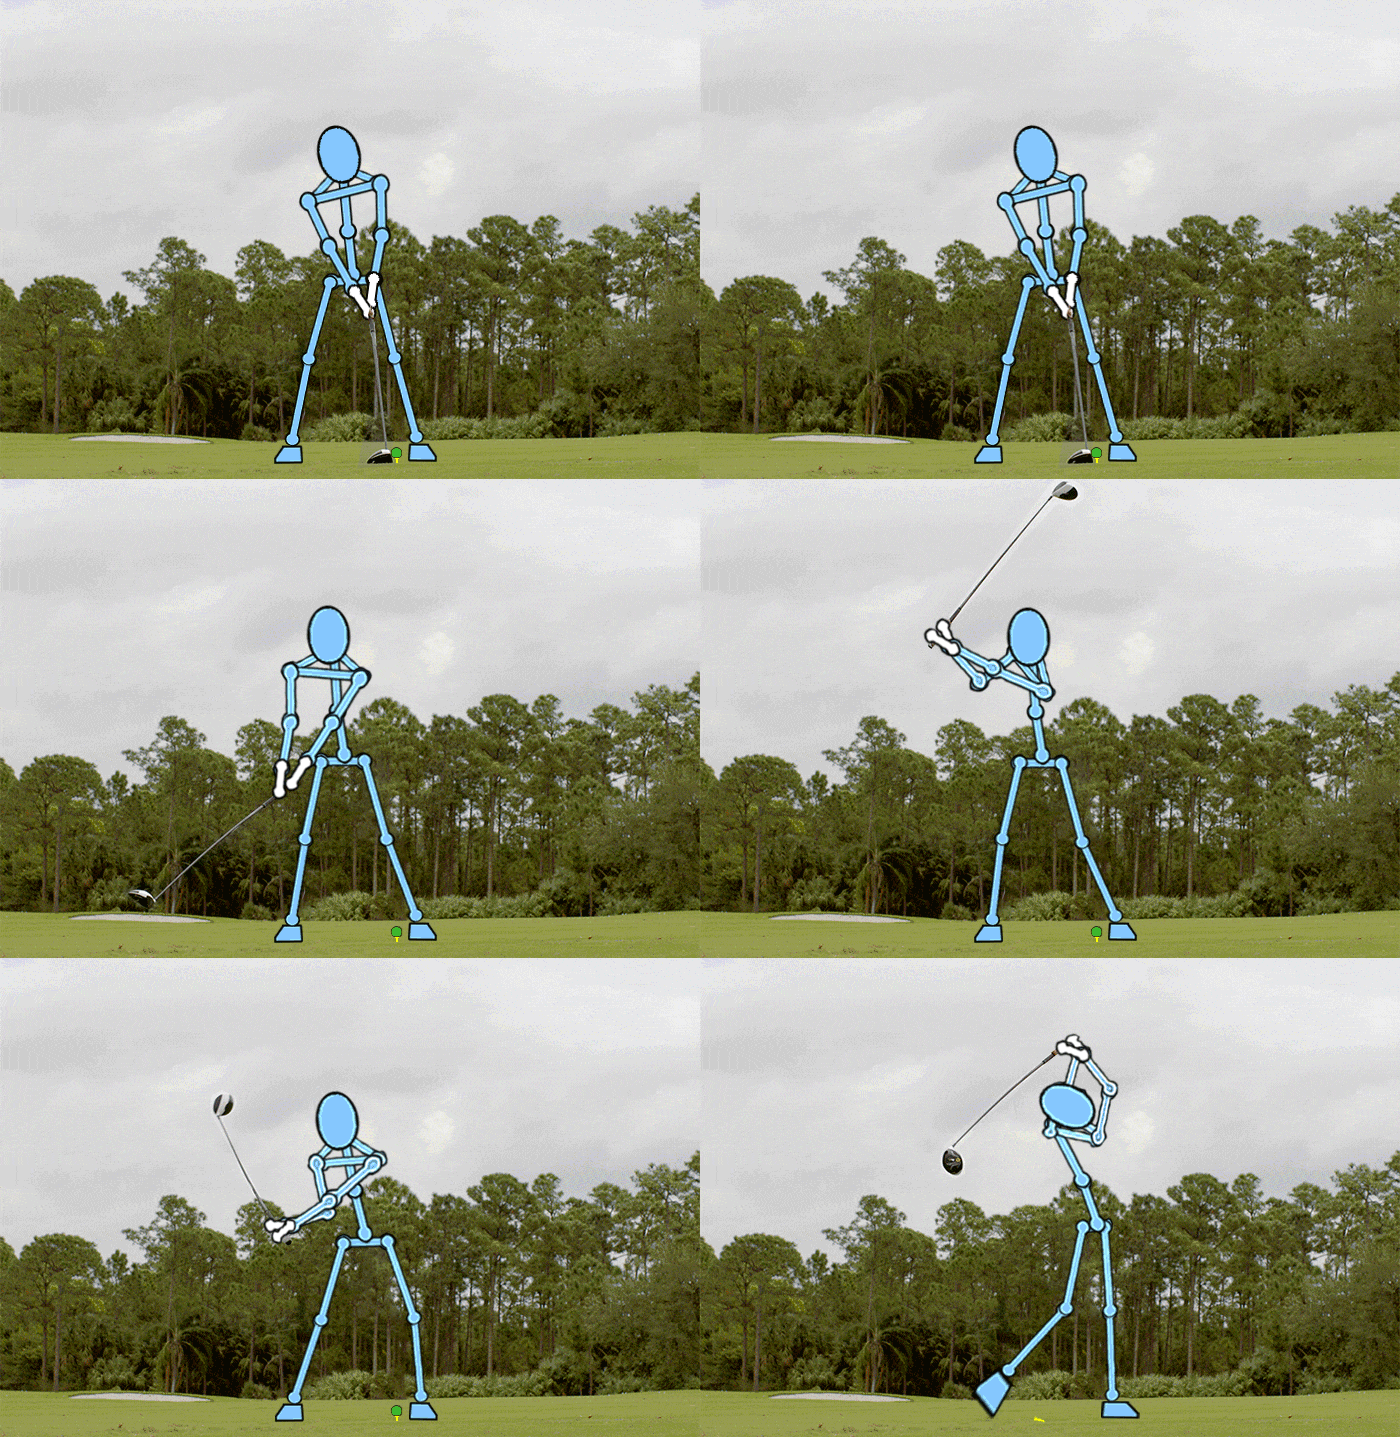
Swing Analysis
  1. Ball Carry = 252.2 yds
  2. Club Speed = 101.2 mph
  3. Ball Speed = 146.5 mph
  4. Launch V Angle = 12.4°
  5. Spin Rate = 3295 rpm
  6. Smash Factor = 1.46
  7. Apex Height = 107.0 feet
  8. Flight Time = 7.09 sec
  9. Angle of Attack = 1.4°
  10. Spin Loft = 12.4°
  11. Launch H Angle= 2.2 R°
  12. Spin Axis = 5.3 R°
  13. Roll Out = 6.2 yds
  14. Total Distance = 258.4 yds
  15. Lateral Distance= 22.6 R yds
  16. Club Path = 1.6 R°
  17. Face To Path = 0.6 R°
  18. Face To Target = 2.3 R°
  19. Dynamic Loft = 13.7°
  20. Descent V = 41.9°
  21. V-Swing Plane = 46.4°
  22. H-Swing Plane = 2.9 R°
  23. Low Point = -1.6 inches
  24. Curve Distance = 12.6R yds
  25. Shot Type = FADE

What is Doppler Radar? 


Ultrasonic

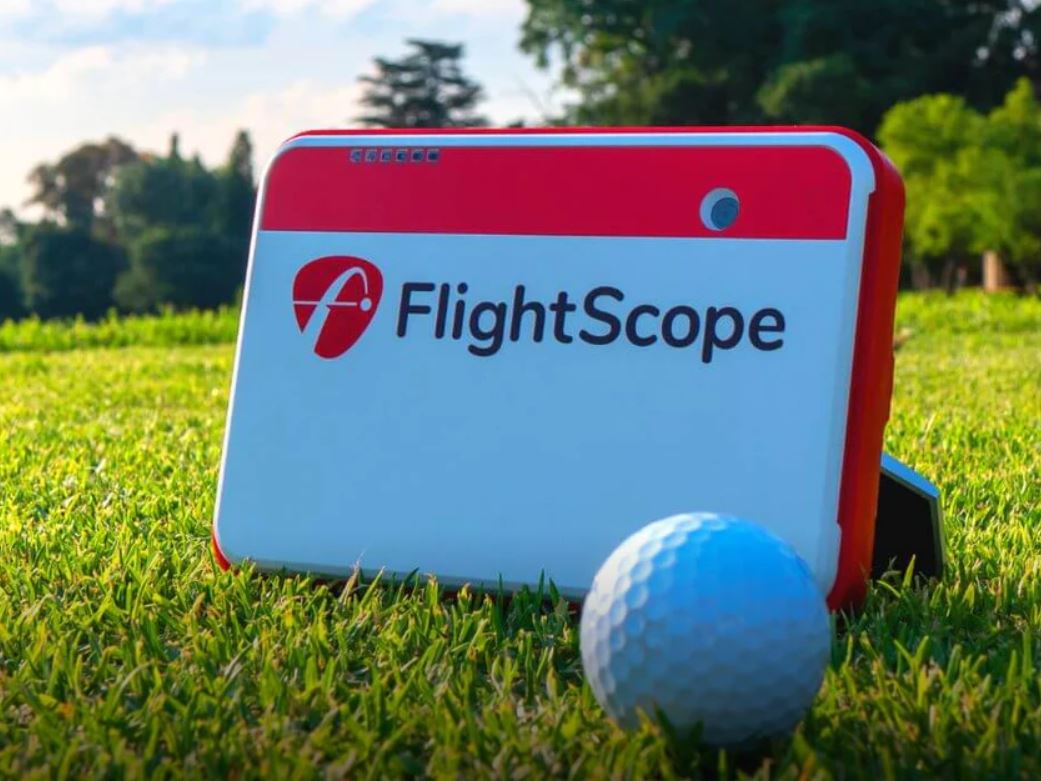
Our system uses the Flightscope Mevo. This system utilizes Doppler Radar.

Doppler ultrasound works by bouncing sound waves in a direction from a source location. In other words, it bounces sound waves from the unit off the golfer, the club and the golf ball.

The Mevo+ (ultrasound device) then measures the echoes as they bounce back. Objects that are moving away from the source make different echoes than objects that are moving closer to the source.

We have all experienced this with a siren (moving from ultrasonic which is sound with a higher frequency than humans can detect to sound waves we can detect / hear). When the emergency vehicle is coming at you the siren sounds higher in pitch than the same siren as it passes and starts moving away from you. This is due to the sound wave coming to you faster with each wave as it gets closer to you, and then coming slower as each wave gets further from you. This is the principle of the technology in the Golf simulator unit shown in the picture above.